


Mid-year update
Drew O’Neil discusses fixed income market conditions and offers insight for bond investors.
The first half of 2026 has provided a considerable amount of news for investors to digest. Notably, equity markets were higher by nearly 10%, oil prices spiked over 50% before retreating nearly back to where they started, there is a new Chair of the Federal Reserve in Kevin Warsh, and AI infrastructure spending surged. How did all of this, plus countless other influences, affect the fixed income markets through the first half of the year?
FOMC
At the start of the year, markets were expecting at least two 25 basis point cuts to the Fed Funds rate by the end of the year, one of which was predicted to have already happened by now (per Bloomberg calculations). Fast forward to July 1st and expectations have flipped around. Not only have there been no changes to the Fed Funds rate, but markets are now predicting at least one 25 basis point increase between now and the end of the year. What has changed? In short, inflation has moved consistently higher while the labor market has remained strong. Chair Warsh made it clear at the FOMC meeting last month that the Committee was focused on getting inflation back down. The FOMC statement notably did not even mention the labor market while concluding with a pointed sentence: “The Committee will deliver price stability.”
Treasury Market
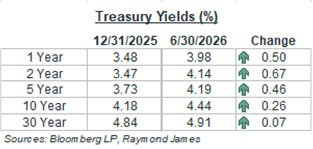
While Treasury yields across the entire curve have moved higher, the shift in Fed Funds rate expectations, noted above, have led to much larger yield increases on the short-end versus the long-end of the curve. Yields from 1 to 5 years are higher by 46 to 67 basis points while the 30-year yield is only 7 basis points higher. As a result, the Treasury curve has flattened. The 10-year/2-year slope decreased by ~40 basis points; while the 30-year/2-year slope fell by ~59 basis points.
Corporate Bond Market
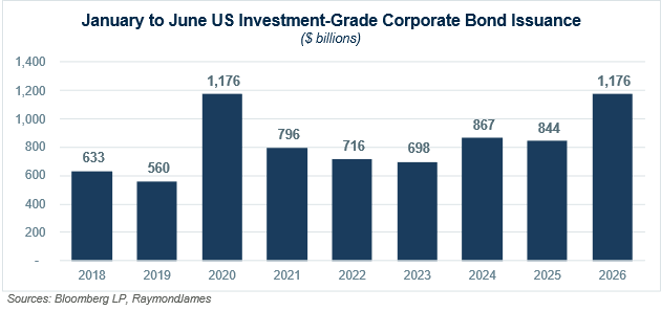
Changes in investment-grade corporate bond yields mostly mirrored the moves in the Treasury market, as spreads were virtually unchanged. Across the short and intermediate part of the curve, yields were higher by 30 to 60 basis points. Investment-grade corporate bond spreads remain near all-time lows. Although spreads are low, elevated benchmark yields mean that corporate yields are at some of their most attractive levels of the past 15+ years. New issuance was a major story over the first half of the year, as investment-grade issuance is at a five-year high with over $1.1 trillion coming to market.
Municipal Bond Market
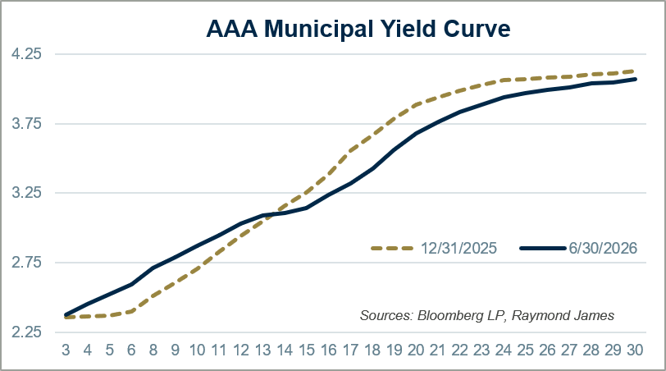
Yield changes in the municipal market were somewhat mixed over the first half of the year. As opposed to their taxable counterparts, municipal yields rose on the short-end of the curve but fell across the longer part of the curve. This can be viewed as somewhat of a normalization, as the short-end of the curve was fairly rich to start the year while longer-term yields were relatively cheap. The year-to-date yield moves closed this gap somewhat, although the general dynamics remain. While the municipal curve has flattened slightly, it is still steeper than comparable taxable curves, providing investors with increasing yield opportunities the further maturities are extended.
Mid-Year Takeaway
Yields remain attractive for most investment-grade bonds, offering investors yields that are near some of their highest levels of the past 15+ years. Even with the small pullback, longer-term municipal yields continue to provide higher tax bracket investors with an exceptional opportunity to lock in yields for an extended period of time. How long the current window of opportunity remains open is anyone’s guess, but for the time being, there are attractive options across the product and maturity spectrum for fixed income investors to take advantage of.
The author of this material is a Trader in the Fixed Income Department of Raymond James & Associates (RJA), and is not an Analyst. Any opinions expressed may differ from opinions expressed by other departments of RJA, including our Equity Research Department, and are subject to change without notice. The data and information contained herein was obtained from sources considered to be reliable, but RJA does not guarantee its accuracy and/or completeness. Neither the information nor any opinions expressed constitute a solicitation for the purchase or sale of any security referred to herein. This material may include analysis of sectors, securities and/or derivatives that RJA may have positions, long or short, held proprietarily. RJA or its affiliates may execute transactions which may not be consistent with the report’s conclusions. RJA may also have performed investment banking services for the issuers of such securities. Investors should discuss the risks inherent in bonds with their Raymond James Financial Advisor. Risks include, but are not limited to, changes in interest rates, liquidity, credit quality, volatility, and duration. Past performance is no assurance of future results.
Investment products are: not deposits, not FDIC/NCUA insured, not insured by any government agency, not bank guaranteed, subject to risk and may lose value.
To learn more about the risks and rewards of investing in fixed income, access the Financial Industry Regulatory Authority’s website at finra.org/investors/learn-to-invest/types-investments/bonds and the Municipal Securities Rulemaking Board’s (MSRB) Electronic Municipal Market Access System (EMMA) at emma.msrb.org.
